How Can a Wellness Technology Company Play it Smart?
Bellabeat Case Study: SQL, Excel, and Tableau

Links to Tableau Dashboard and Github Code
Scenario
For the purposes of this case study, I am a junior data analyst working on the marketing analyst team at Bellabeat, a high-tech manufacturer of health-focused products for women. Bellabeat is a successful small company, but they have the potential to become a larger player in the global smart device market. Urška Sršen, cofounder and Chief Creative Officer of Bellabeat, believes that analyzing smart device fitness data could help unlock new growth opportunities for the company. I have been asked to focus on one of Bellabeat’s products and analyze smart device data to gain insight into how consumers are using their smart devices. The insights I discover will then help guide marketing strategy for the company.
Characters and Products
Stakeholders
- Urška Sršen: Bellabeat’s cofounder and Chief Creative Officer
- Sando Mur: Mathematician and Bellabeat’s cofounder; key member of the Bellabeat executive team
- Bellabeat marketing analytics team: A team of data analysts responsible for collecting, analyzing, and reporting data that helps guide Bellabeat’s marketing strategy
Products
- Bellabeat app: The Bellabeat app provides users with health data related to their activity, sleep, stress, menstrual cycle, and mindfulness habits. This data can help users better understand their current habits and make healthy decisions. The Bellabeat app connects to their line of smart wellness products.
- Leaf: Bellabeat’s classic wellness tracker can be worn as a bracelet, necklace, or clip. The Leaf tracker connects to the Bellabeat app to track activity, sleep, and stress.
- Time: This wellness watch combines the timeless look of a classic timepiece with smart technology to track user activity, sleep, and stress. The Time watch connects to the Bellabeat app to provide you with insights into your daily wellness.
- Spring: This is a water bottle that tracks daily water intake using smart technology to ensure that you are appropriately hydrated throughout the day. The Spring bottle connects to the Bellabeat app to track your hydration levels.
- Bellabeat membership: Bellabeat also offers a subscription-based membership program for users. Membership gives users 24/7 access to fully personalized guidance on nutrition, activity, sleep, health and beauty, and mindfulness based on their lifestyle and goals.
Current Marketing Strategies
Collecting data on activity, sleep, stress, and reproductive health has allowed Bellabeat to empower women with knowledge about their own health and habits. Since it was founded in 2013, Bellabeat has grown rapidly and quickly positioned itself as a tech-driven wellness company for women.
The company has invested in traditional advertising media, such as radio, out-of-home billboards, print, and television, but focuses on digital marketing extensively. Bellabeat invests year-round in Google Search, maintaining active Facebook and Instagram pages, and consistently engages consumers on Twitter. Additionally, Bellabeat runs video ads on Youtube and display ads on the Google Display Network to support campaigns around key marketing dates.
Sršen knows that an analysis of Bellabeat’s available consumer data would reveal more opportunities for growth. She has asked the marketing analytics team to focus on a Bellabeat product and analyze smart device usage data in order to gain insight into how people are already using their smart devices. Then, using this information, she would like high-level recommendations for how these trends can inform Bellabeat marketing strategy
Project Deliverables
- Clear Summary of Business task
- Preparing all data sources used
- Documentation of any cleaning or manipulation of data
- Summary of analysis
- Supporting Visualizations and key findings
- Top high-level content recommendations based on the analysis
Tools Used in Analysis
- Data Cleaning: Microsoft Excel
- Data Analysis: MySQL Server
- Data Visualization: Tableau Public
Clear Summary of Business Task
Business Task
The business task is to analyze smart device usage trends to gain insights on how consumers use these devices. The goal is to apply these insights to Bellabeat's products, ultimately informing and refining Bellabeat's marketing strategy to drive customer engagement and growth.
The Problem We're Trying to Solve
Bellabeat aims to become a larger player in the global smart device market. To achieve this we need to:
- Understand current trends in smart device usage.
- Leverage these insights to enhance product offerings, better meet customer needs, and refine the marketing strategies.
- Improve customer engagement and retention by offering personalized experience and encouraging more frequent use of Bellabeat products.
How These Insights will Drive Business Decisions?
- Product Development: Bellabeat can refine existing products or create features based on popular trends from non-Bellabeat devices. In this case study, I will be analyzing Fitbit data.
- Marketing Campaigns: tailoring marketing efforts to emphasize Bellabeat's competitive advantages and attract new users who value health, fitness, and stylish design
- User Engagement: offer more personalized experiences and gamification elements, increasing customer engagement and usage frequency.
- Strategic Partnerships: could lead to opportunities for Bellabeat to partner with other health apps or platforms to create a more integrated user experience.
Preparing the Data Sources
Summary of Data Source Used
To answer Bellabeat's business tasks, I will be using FitBit Fitness Tracker Data (CC0: Public Domain, dataset made available through Mobius). This Kaggle data set comprises 18 files containing personal fitness tracker from thirty Fitbit users. Thirty eligible Fitbit users consented to the submission of personal tracker data, including minute-level output for physical activity, heart rate, and sleep monitoring. It includes information about daily activity, steps, and heart rate that can be used to explore users’ habits.
Some Considerations about the dataset
- Sampling bias: May apply, it is unclear how the participants were chosen
- Small Sample Size: Data only contains 30 Fitbit users, which is a small sample size and does not represent the broader population
- Skewed Data: Since it is limited to users who already own Fitbit devices, the data could skew toward already more health-conscious individuals.
- Old Data: The data is from 2016, so it is outdated at the time of this analysis
- Short Time Period: All data was collected over 1-month time span, not enough time to find accurate and reliable trends
- No Demographic Data: Dataset does not provide information about the gender or age of the users. Bellabeat is a health-tech company focused on products for women
- Only Represents one device: Since this is FitBit data, it lacks relevant information to the Spring product and the Bellabeat app, therefore limiting the scope of the analysis to the Time smart device.
Processing and Cleaning the Dirty Data
Data Cleaning in Excel
The following updates were completed in GoogleSheets in order to clean data effectively.
- Removal of Unwanted Tables: As
daily_steps, daily_caloriesanddaily_intensitiestable were part ofdaily_activity table; therefore, these files were removed. There are also wide and narrow versions of all of the sheets, I will be using the wide versions for analysis. - Remove Duplicates: Checked for duplicate data using 'duplicate data tool'
- In the
SleepDaydataset there were 3 duplicate rows found and removed
- In the
- Standardized Dates: Formatted date data in all tables by using Format --> Number -->DateTime
- Standardized Numbers: Formatted all numerical data into 4 decimal points
- Added Weekday Column: In the
dailyactivityadded a new column call day of week, so I can analyze weekday and weekend trends. Using the following formula:- = TEXT('ActivityDate', "DDDD")
- Exported datasets as CSV Files
Data Analysis, Visualizations, and Key Findings
Upload Data to SQL Server
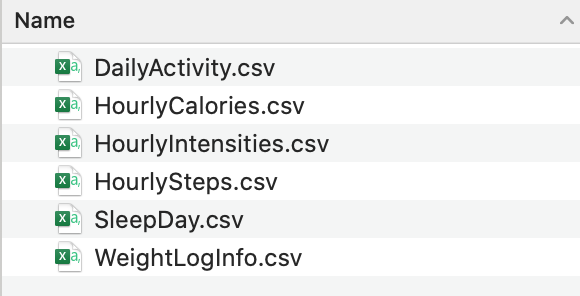
For analysis, I have centralized all of the data into MySQL. This allowed me to easily manage the entirety of the files and make relevant queries, as the CSV files can be transformed into tables. I uploaded the following six clean data sets to MySQL Workbench:
After upload, I ran a quick Select All Statement for each of the tables to ensure that everything was uploaded correctly.
Count Distinct Entries
First, I ran a COUNT(DISTINCT ) function to see how many unique number of IDs are in each of the tables. I ran the following code for all 6 tables I uploaded to MySQL.
SELECT COUNT(DISTINCT Id) AS distinct_ids
FROM `Bellabeats`.`dailyactivity`;
- In the
dailyactivities,hourlycalories, hourlyintensities, andhourlystepstables there were 33 distinct IDs - In the
sleepdaytable there were 24 distinct IDs - In the
weightloginfotable there were only 8 distinct IDs. Given that this is a small sample size, it will not provide sufficient data for meaningful analysis. Therefore, I will exclude this table moving forward
Classifying Users by Wearable Device Usage
The first thing I want to investigate, is how many days did the user wear their Fitbit tracker in a month.
SELECT
	Count(ID) AS NumUsers,
    	NumDaysLogged
FROM
	(SELECT
        ID,
        COUNT(*) AS NumDaysLogged
	FROM `Bellabeats`.`dailyactivity`
	GROUP BY ID) AS LoggedUsageTable
GROUP BY NumDaysLogged
ORDER BY NumDaysLogged DESC
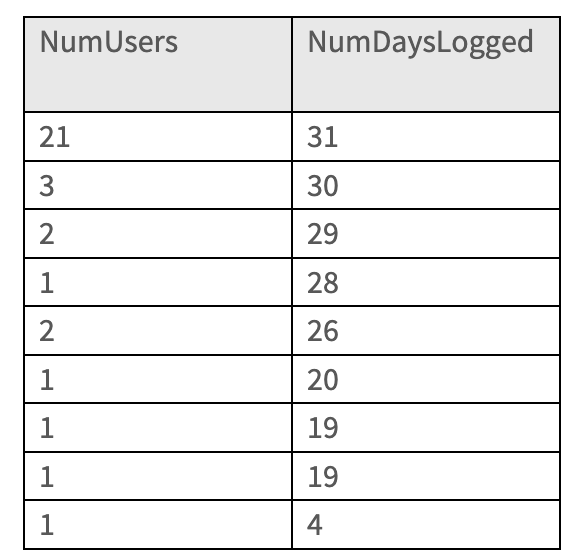
Around 64% of users wore their FitBit tracker for the whole month. This makes sense for the context of the data set since this survey was distributed to existing FitBit users, and those users who consistently wear their watches would be more inclined to respond to the survey.
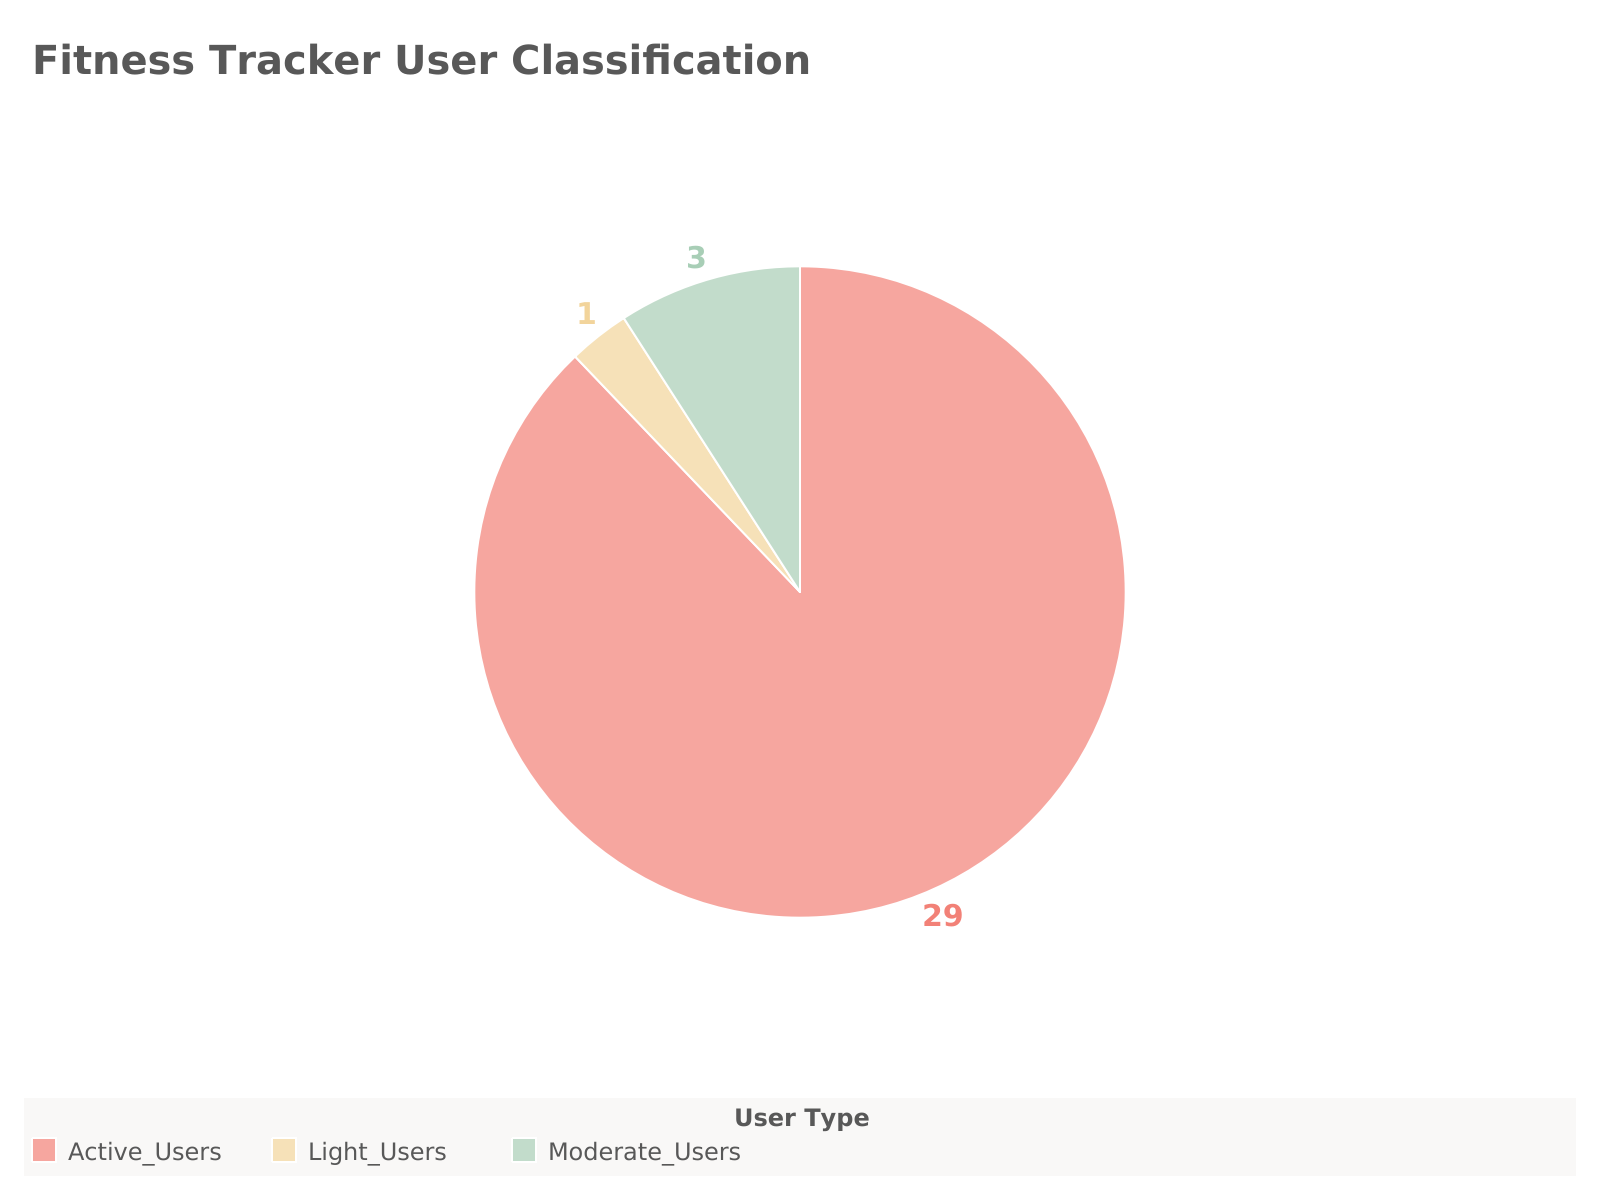
Now I want to classify these users based on how consistently they wear their FitBit.
- Active Users: wear their watch between 31 and 25 days
- Moderate Users: wear their watch between 24 and 15 days
- Light Users: wear their watch between 14 and 0 days
SELECT
    SUM(CASE
        WHEN NumDaysLogged BETWEEN 25 AND 31 THEN 1
        ELSE 0
    END) AS Active_Users,
    SUM(CASE
        WHEN NumDaysLogged BETWEEN 15 AND 24 THEN 1
        ELSE 0
    END) AS Moderate_Users,
    SUM(CASE
        WHEN NumDaysLogged BETWEEN 0 AND 14 THEN 1
        ELSE 0
    END) AS Light_Users
FROM (
    SELECT
        ID,
        COUNT(*) AS NumDaysLogged
    FROM `Bellabeats`.`dailyactivity`
    GROUP BY ID
) AS LoggedUsageTable;
Exploring Data Further
Now I want to get into more granular data for analysis. From the dailyactivity table I want to look at some averages of the dataset to see where I should investigate further.
SELECT
    AVG(VeryActiveMinutes),
    AVG(FairlyActiveMinutes),
    AVG(LightlyActiveMinutes),
    AVG(SedentaryMinutes),
    AVG(TotalSteps),
    AVG(Calories)
FROM `Bellabeats`.`dailyactivity`;

SELECT
    AVG(TotalMinutesAsleep),
    AVG(TotalTimeInBed)
FROM `Bellabeats`.`sleepday`;
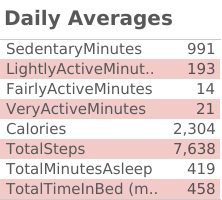
Some insights from this query:
- The
AVG(SedentaryMinutes)is 991.2 which is close to 16.5 hours per day. This is high for health and wellness users. - Comparing the three
ActiveMinutescolumns, it seems the majority of users participate in light physical activity compared toFairlyActiveandVeryActiveminutes. - The
AVG(TotalSteps)is 7,638 steps per day which is less than the CDC recommended 8,000 to 10,000 steps per day for adults younger than 60 years old.
Peak Hours and Days for Physical Activity
Now I want to investigate what days of the week that users are most active.
SELECT
    Weekday,
    AVG(VeryActiveMinutes),
    AVG(FairlyActiveMinutes),
    AVG(LightlyActiveMinutes),
    AVG(SedentaryMinutes)
FROM `Bellabeats`.`dailyactivity`
GROUP BY Weekday
ORDER BY FIELD(Weekday, 'Sunday', 'Monday', 'Tuesday', 'Wednesday', 'Thursday', 'Friday', 'Saturday');
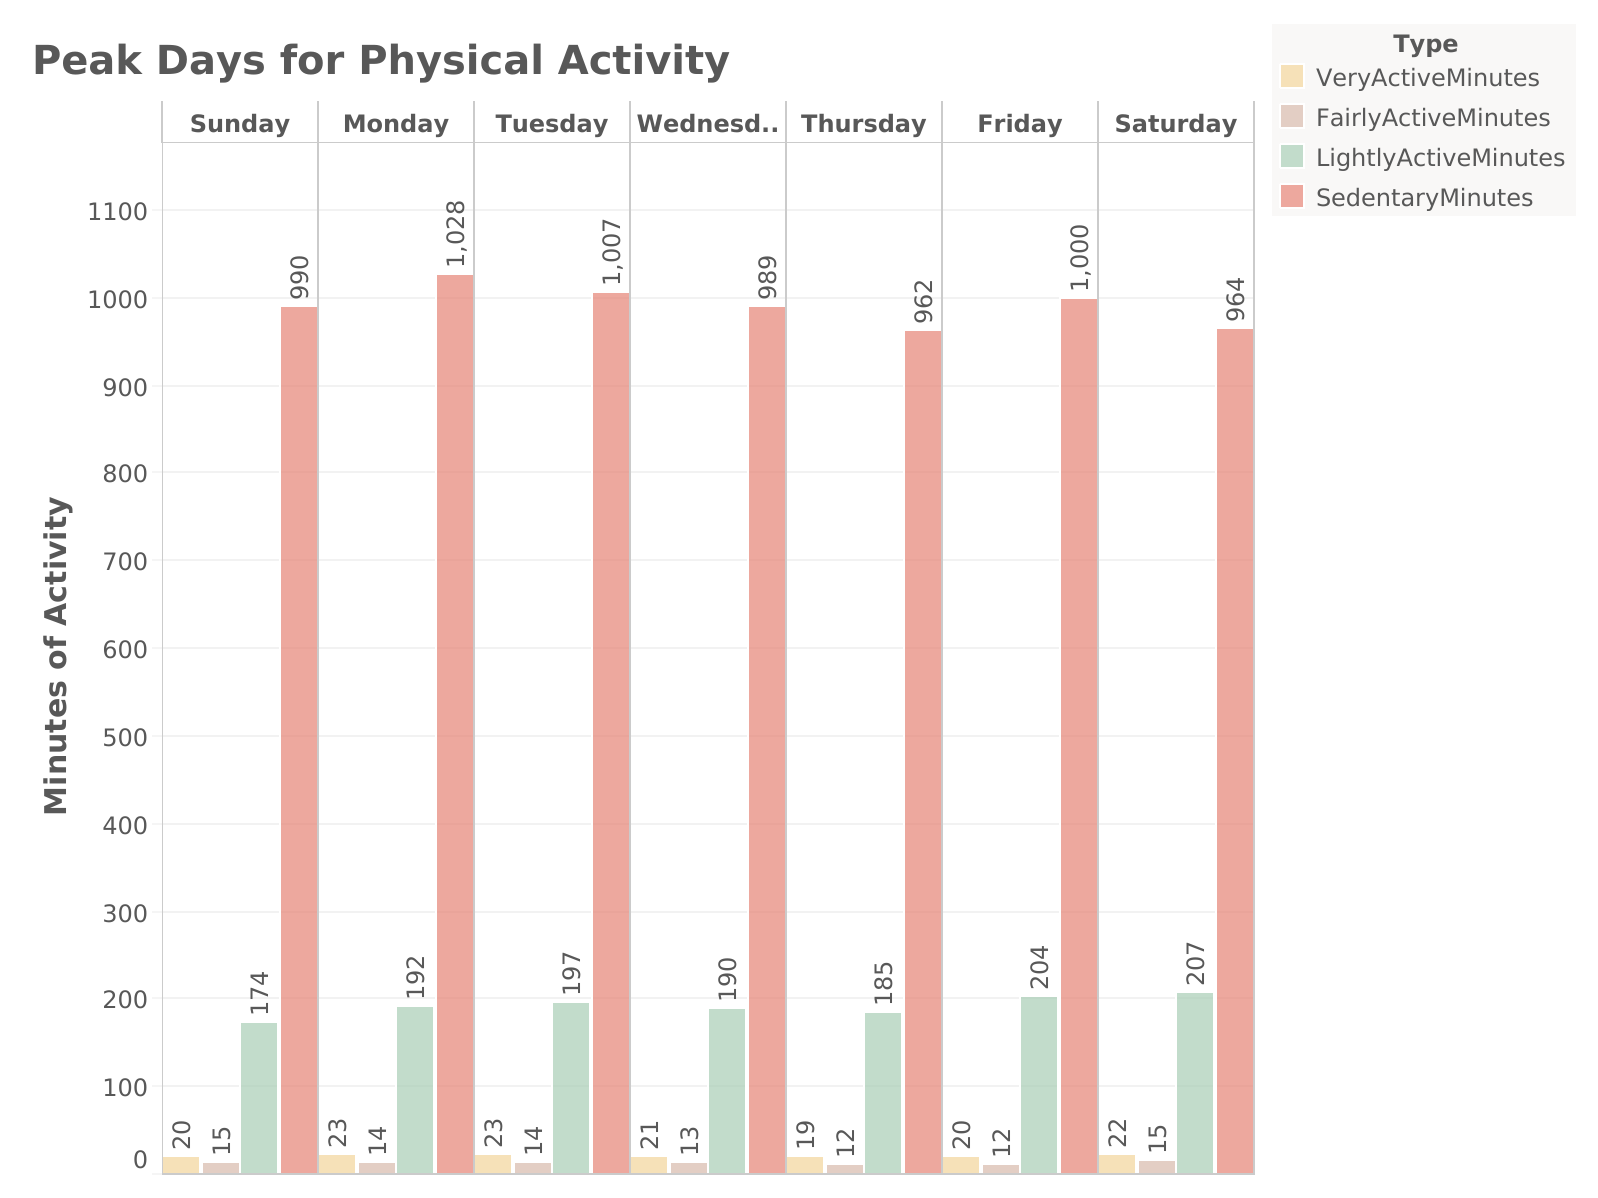
It looks like the average intensities stay consistent throughout the week. Peak days for LightlyActiveMinutes are Friday and Saturday.
Now let's see how the intensity levels vary by the time of day. Before I can do this, I am going to separate out the date from the time in the ActivityHourColumn, then perform the calculation.
-- Let's add the new columns

ALTER TABLE `Bellabeats`.`hourlyintensities`
ADD COLUMN ActivityDate Date;

ALTER TABLE `Bellabeats`.`hourlyintensities`
ADD COLUMN ActivityTime Time;

-- Now let's populate these columns with the data from the activityhour column

UPDATE `Bellabeats`.`hourlyintensities`
SET
	ActivityDate = DATE(activityhour),
    ActivityTime = TIME(activityhour);

-- Now we can find the average intensisty by the hour of the day

SELECT
	ActivityTime,
    AVG(AverageIntensity)
FROM `Bellabeats`.`hourlyintensities`
GROUP BY ActivityTime
ORDER BY ActivityTime ASC;
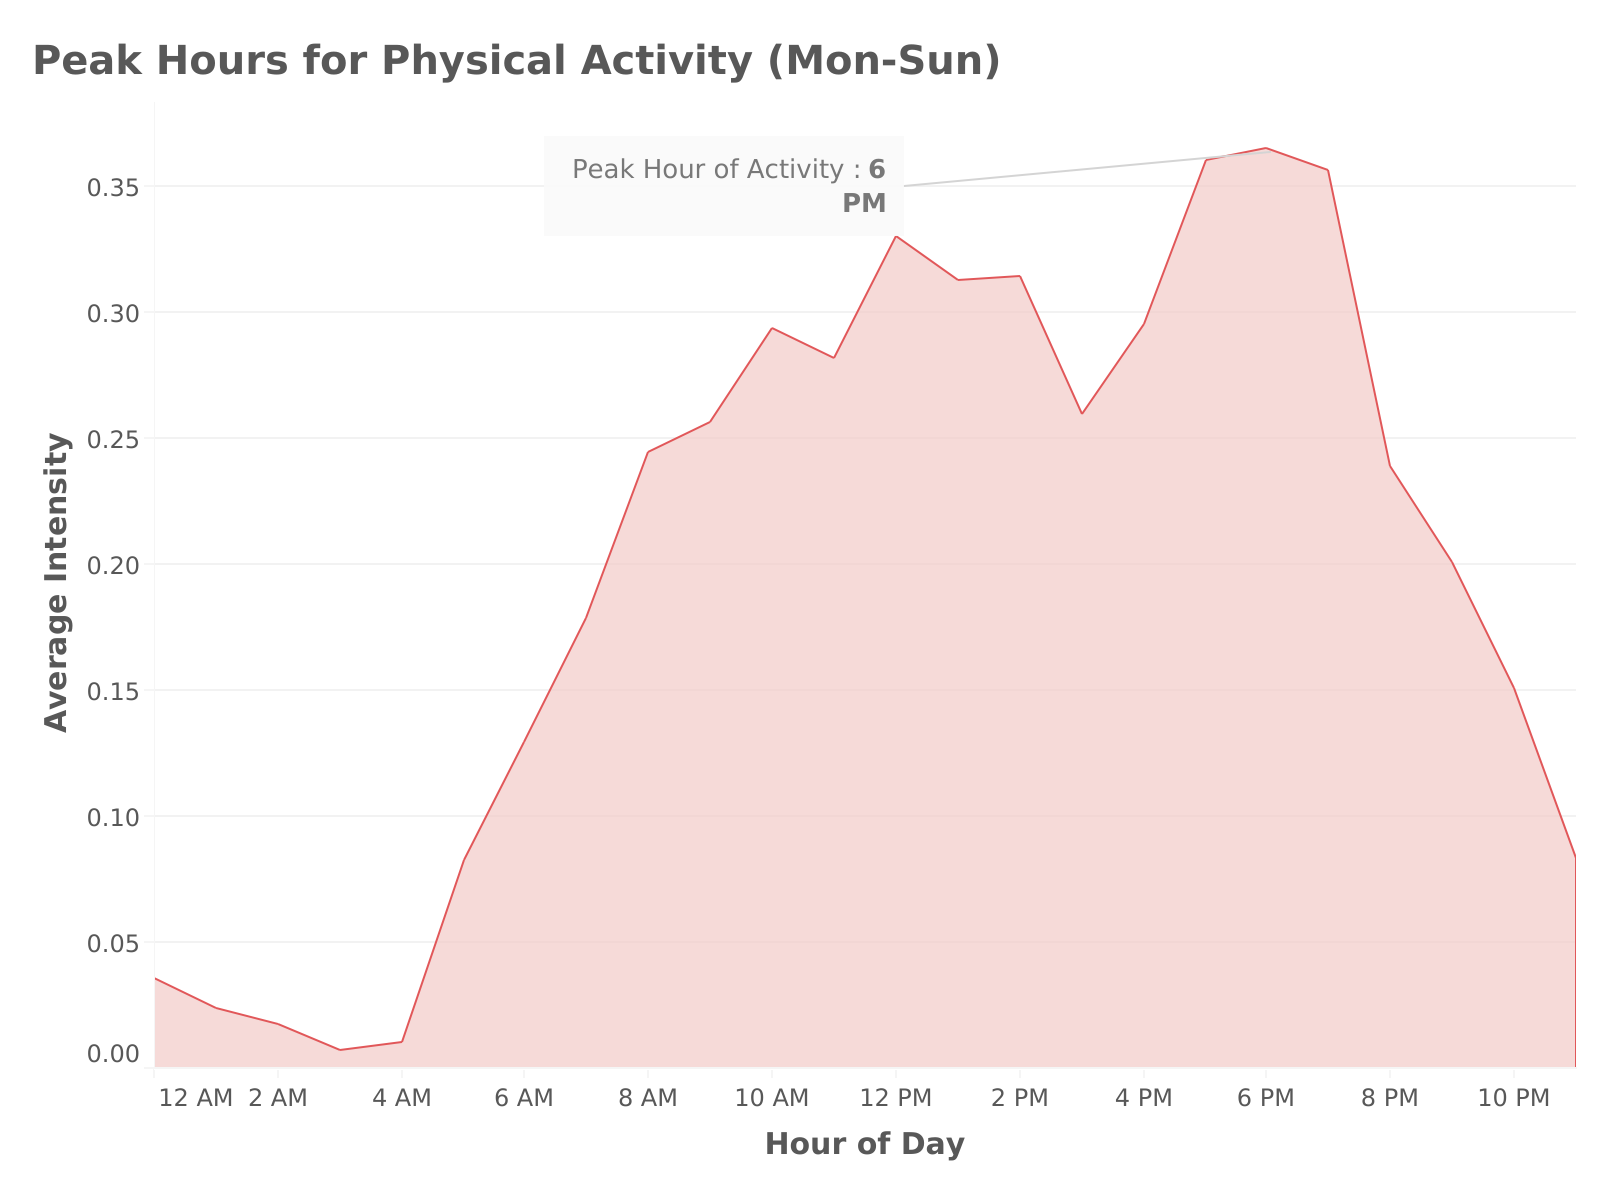
We can see here that peak hours for physical activity are between 5:00 pm - 7:00 pm. This makes sense as most users work and will have this time after work to engage in physical activity. It seems to start dropping off after 8:00 pm, and then begins to pick back up the next day at 5:00 am. Now let's compare the hours for peak physical activity on the weekends:
SELECT
	ActivityTime,
    AVG(AverageIntensity)
FROM `Bellabeats`.`hourlyintensities`
WHERE Weekday IN ('Saturday', 'Sunday')
GROUP BY ActivityTime
ORDER BY ActivityTime ASC;
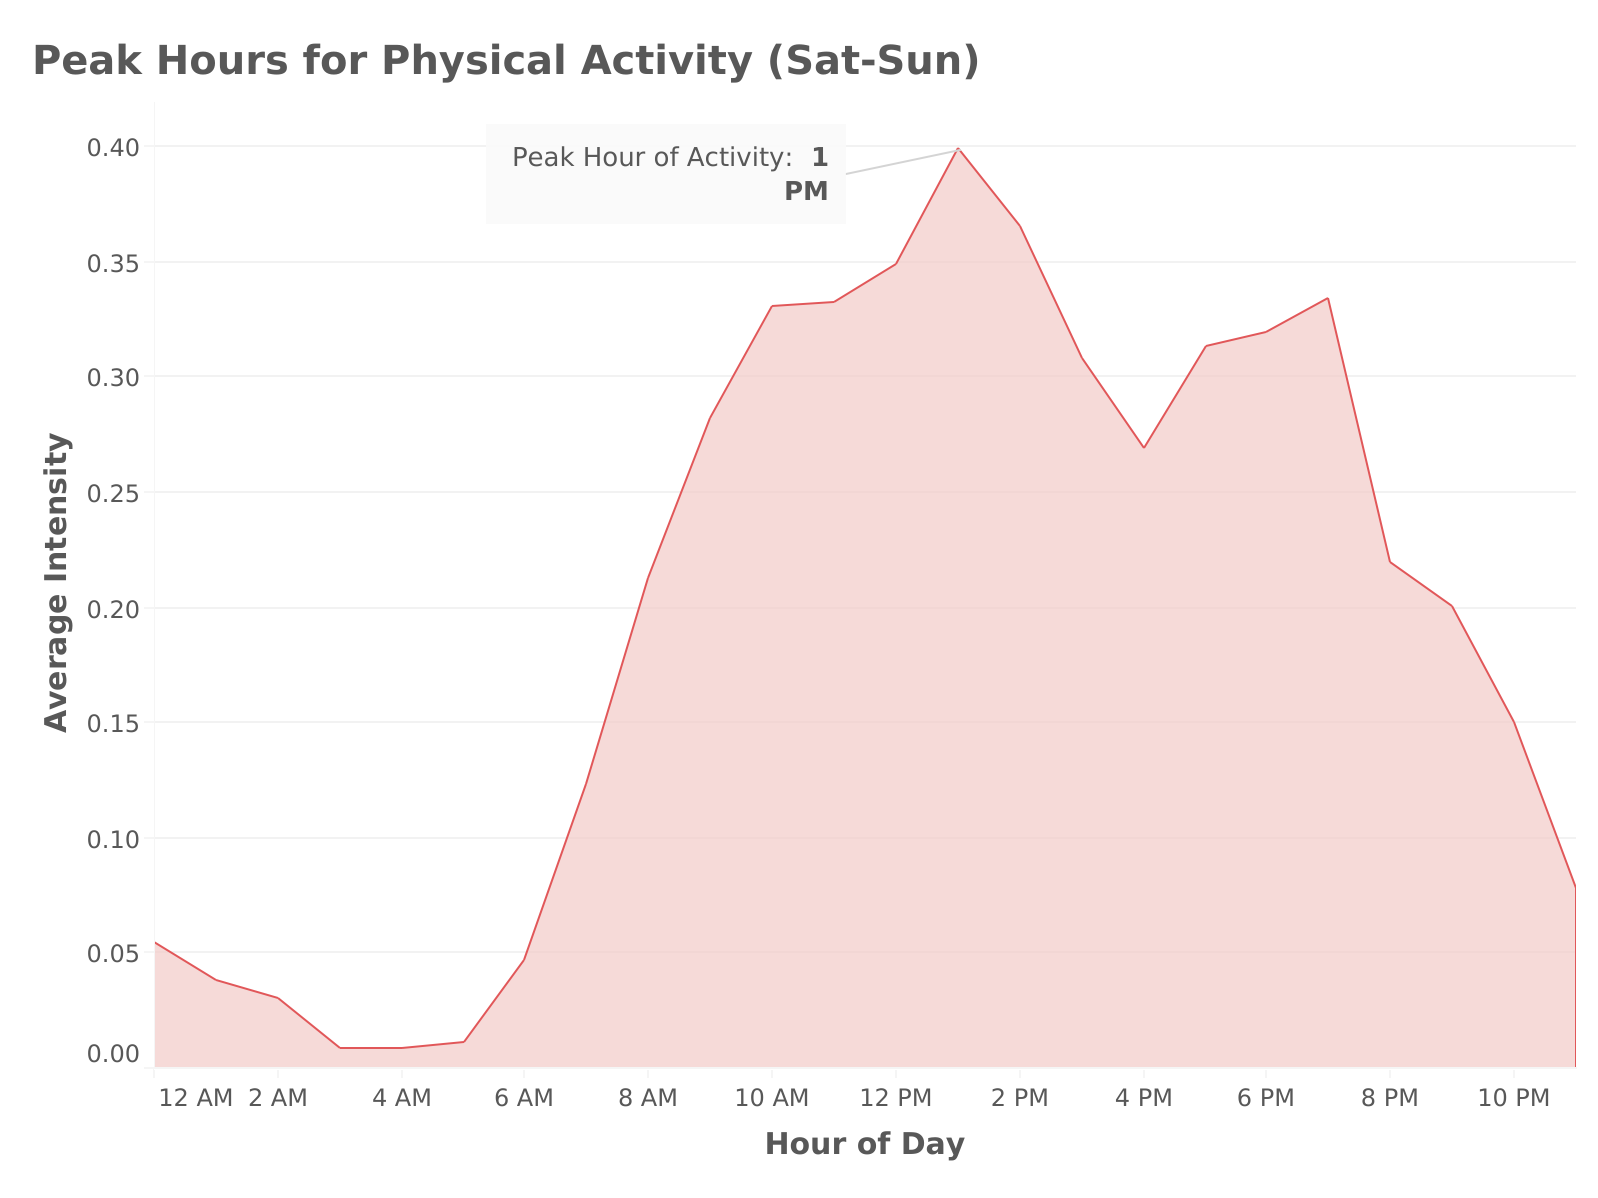
Similar to the full week data (Mon - Sun), weekend activity begins to drop off around 8:00 pm, but the peak hours for activity during the weekend are between 12:00 pm - 2:00 pm, and activity level begins a little later in the day around 6:00 am (most likely as people want to sleep in on the weekends).
Key Takeaways:
- Using this data, Bellabeat can use these peak hours for physical activity to promote fitness challenges or push notifications (e.g., reminders to stay active) during these times.
- Bellabeat can also craft features like workout suggestions for users during these peak hours to increase engagement.
Daily Steps vs. Calories Burned: Understanding Activity Levels
I now want to analyze how active users are throughout the day by comparing their total daily steps with their calories burned per day.
SELECT id,
	Activitydate,
    totalsteps,
    calories AS TotalCalories
FROM `Bellabeats`.`dailyactivity`;
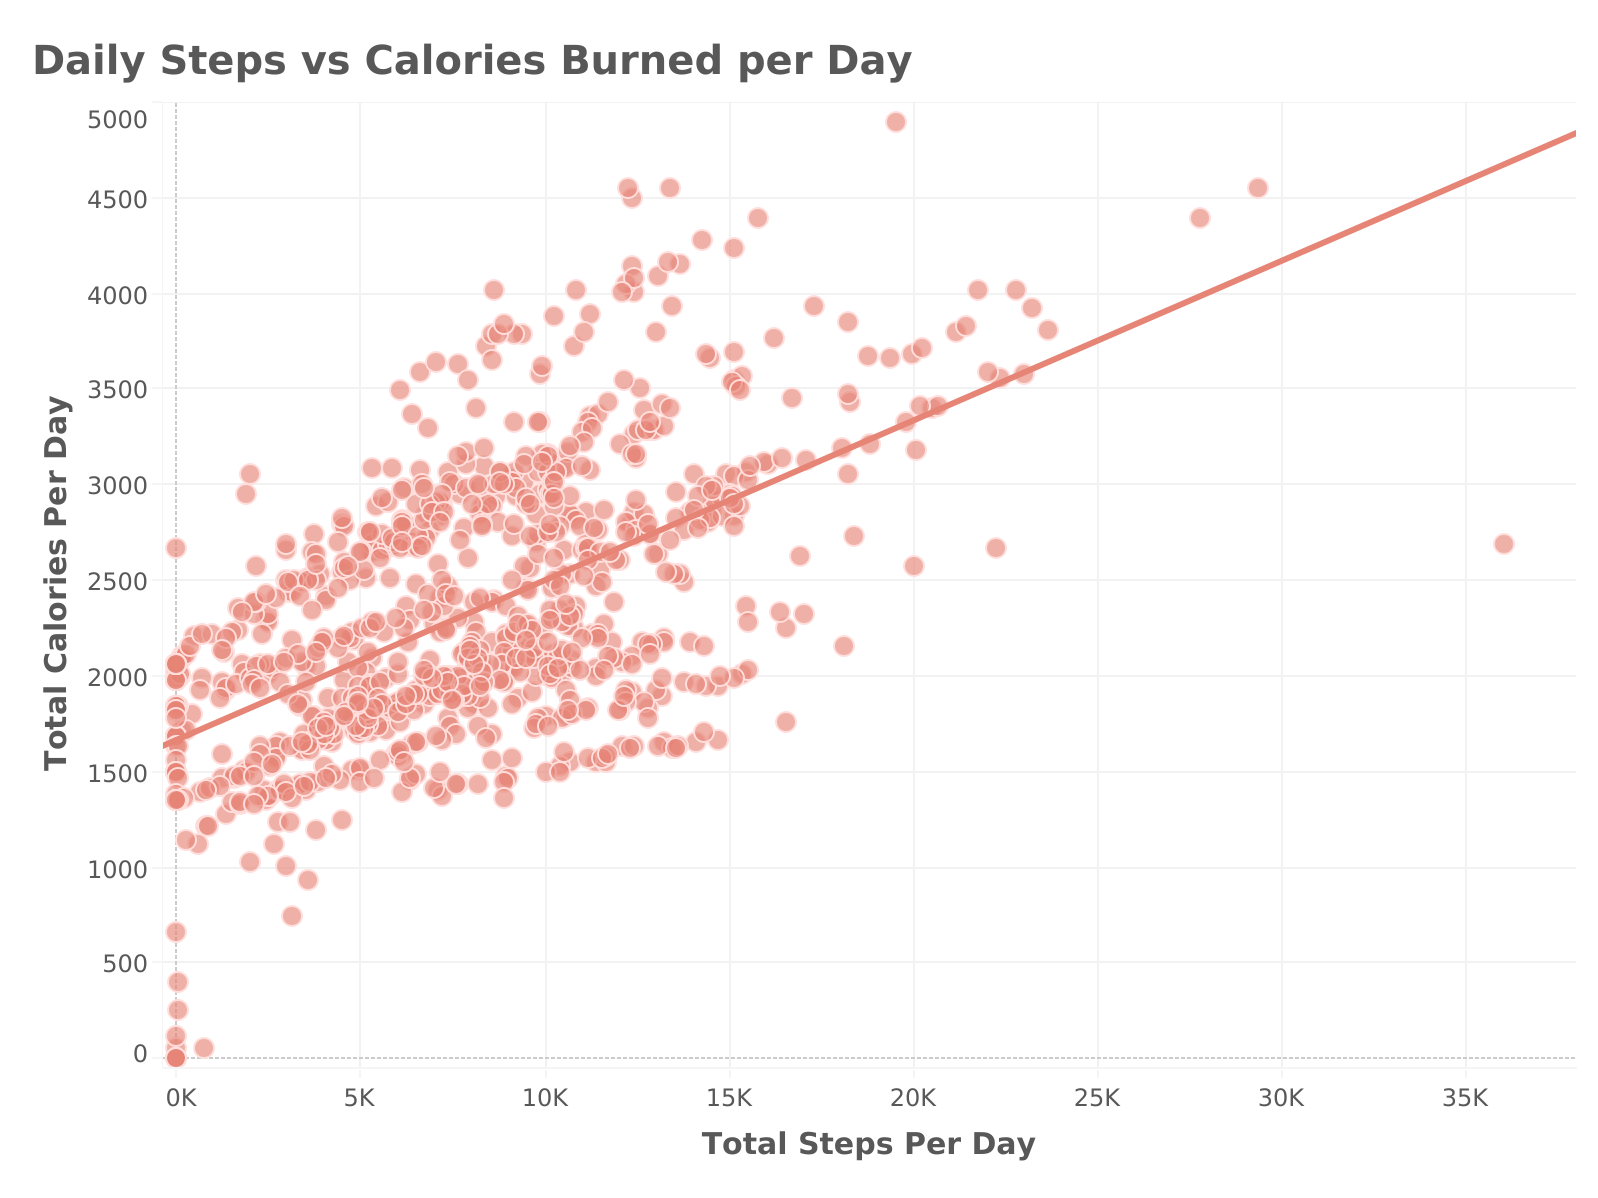
From this scatter plot we can see that there is a consistent relationship between Total Steps taken per day and the total number of calories burned per day.
Key Takeaways:
Using this data, the Bellabeat marketing team could create blog posts, emails, or social media campaigns that explain the relationship between steps and calorie burn, including how users can improve their step count to burn more calories. For example:
- “How Many Calories Can You Burn with 10,000 Steps?”
- “The Science of Steps: Why Walking More Leads to Higher Calorie Burn.”
Cumulative Steps Over Time: Tracking User Activity Progression.
Now I want to know at which hours users reach specific step milestones and see how each user's steps accumulate throughout the day.
-- First lets find the rolling cumulative steps by hour per user
SELECT
	hs.Id,
	hs.ActivityTime,
	hs.StepTotal,
	hs.ActivityDate,
	SUM(hs.StepTotal) OVER (
        PARTITION BY
            hs.ActivityDate,
            hs.ID
	ORDER BY hs.ActivityTime) AS RollingCumulativeSteps
FROM `Bellabeats`.`hourlysteps`

-- Now let's classify these cumulative step counts by milestones

WITH CumulativeSteps AS (SELECT
	hs.Id,
	hs.ActivityTime,
	hs.StepTotal,
	hs.ActivityDate,
	SUM(hs.StepTotal) OVER (
        PARTITION BY
            hs.ActivityDate,
            hs.ID
	ORDER BY id, hs.ActivityTime) AS RollingCumulativeSteps
FROM `Bellabeats`.`hourlysteps` hs
)
SELECT
    Id,
    ActivityDate,
    ActivityTime,
    RollingCumulativeSteps,
	CASE
        WHEN RollingCumulativeSteps BETWEEN 5000 AND 9999 THEN '5000+ Steps'
        WHEN RollingCumulativeSteps BETWEEN 10000 AND 14999 THEN '10000+ Steps'
        WHEN RollingCumulativeSteps >= 15000 THEN '15000+ Steps'
        ELSE 'Below 5000 Steps'
    END AS StepMilestone
FROM CumulativeSteps
ORDER BY Id, ActivityDate, ActivityTime;
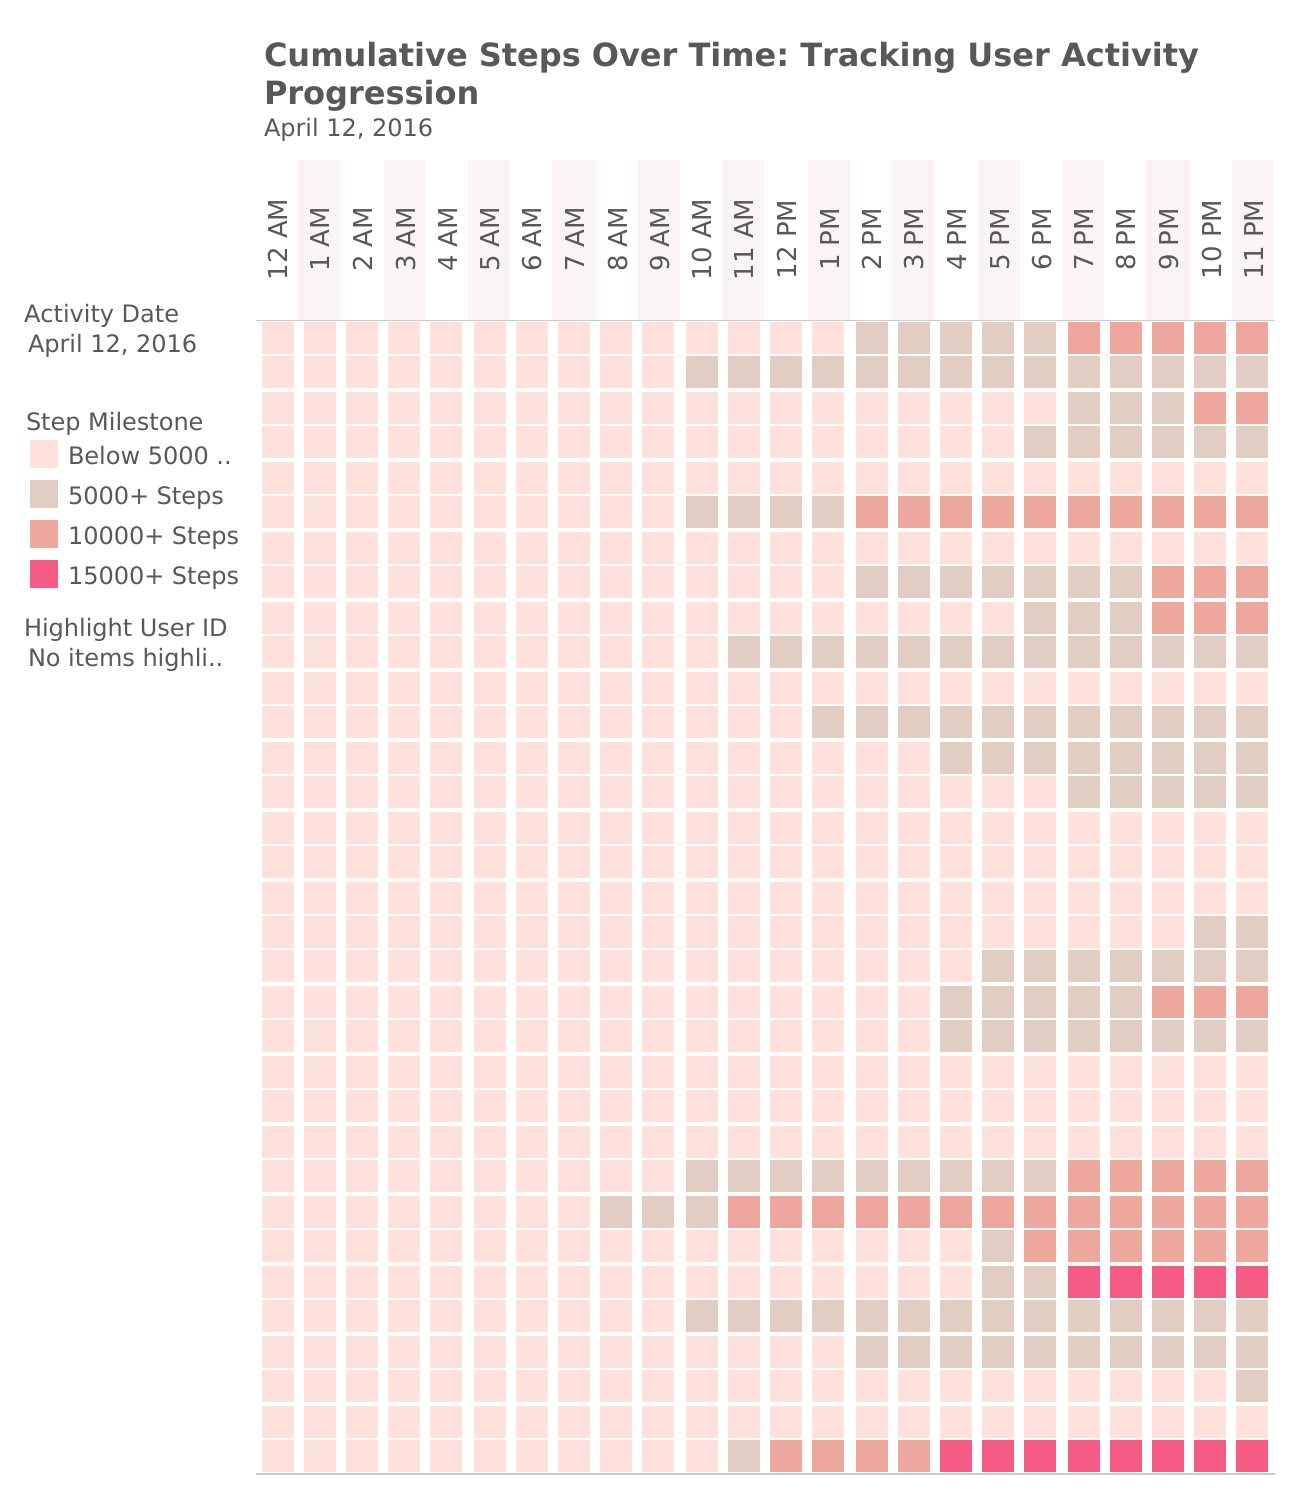
In Tableau, I created a heat-map dashboard to visualize the Cumulative Rolling Step Milestone (color) broken down by Activity Hour vs. User ID. The data is filtered by Activity Date (MDY), which starts on April 12, 2016 and ends May 12, 2016. The data can also highlight each individual User ID on each day.
Key Takeaways:
- This heatmap can help identify the key times when users are most active, or when they fail to reach important step milestones, such as the CDC recommended 10,000 steps per day, allowing Bellabeat to push notifications or features to encourage reach this goal during these slow periods.
- We can also use this data to see if there are any trends across users, like whether users reach their milestones in the morning, afternoon, or evening. This can guide feature enhancements that encourage users to stay active when they tend to slow down.
Sleep Patterns: Sleep Duration vs. Daily Steps
Now let's analyze users' sleep habits and see how this may correlate with their activity levels. First, let's look at the sleep data and see what general trends we can find across each day of the week.
SELECT
	Weekday,
	AVG(TotalMinutesAsleep),
    AVG(TotalTimeInBed)
FROM `Bellabeats`.`sleepday`
GROUP BY Weekday
ORDER BY FIELD(Weekday, 'Sunday', 'Monday', 'Tuesday', 'Wednesday', 'Thursday', 'Friday', 'Saturday');
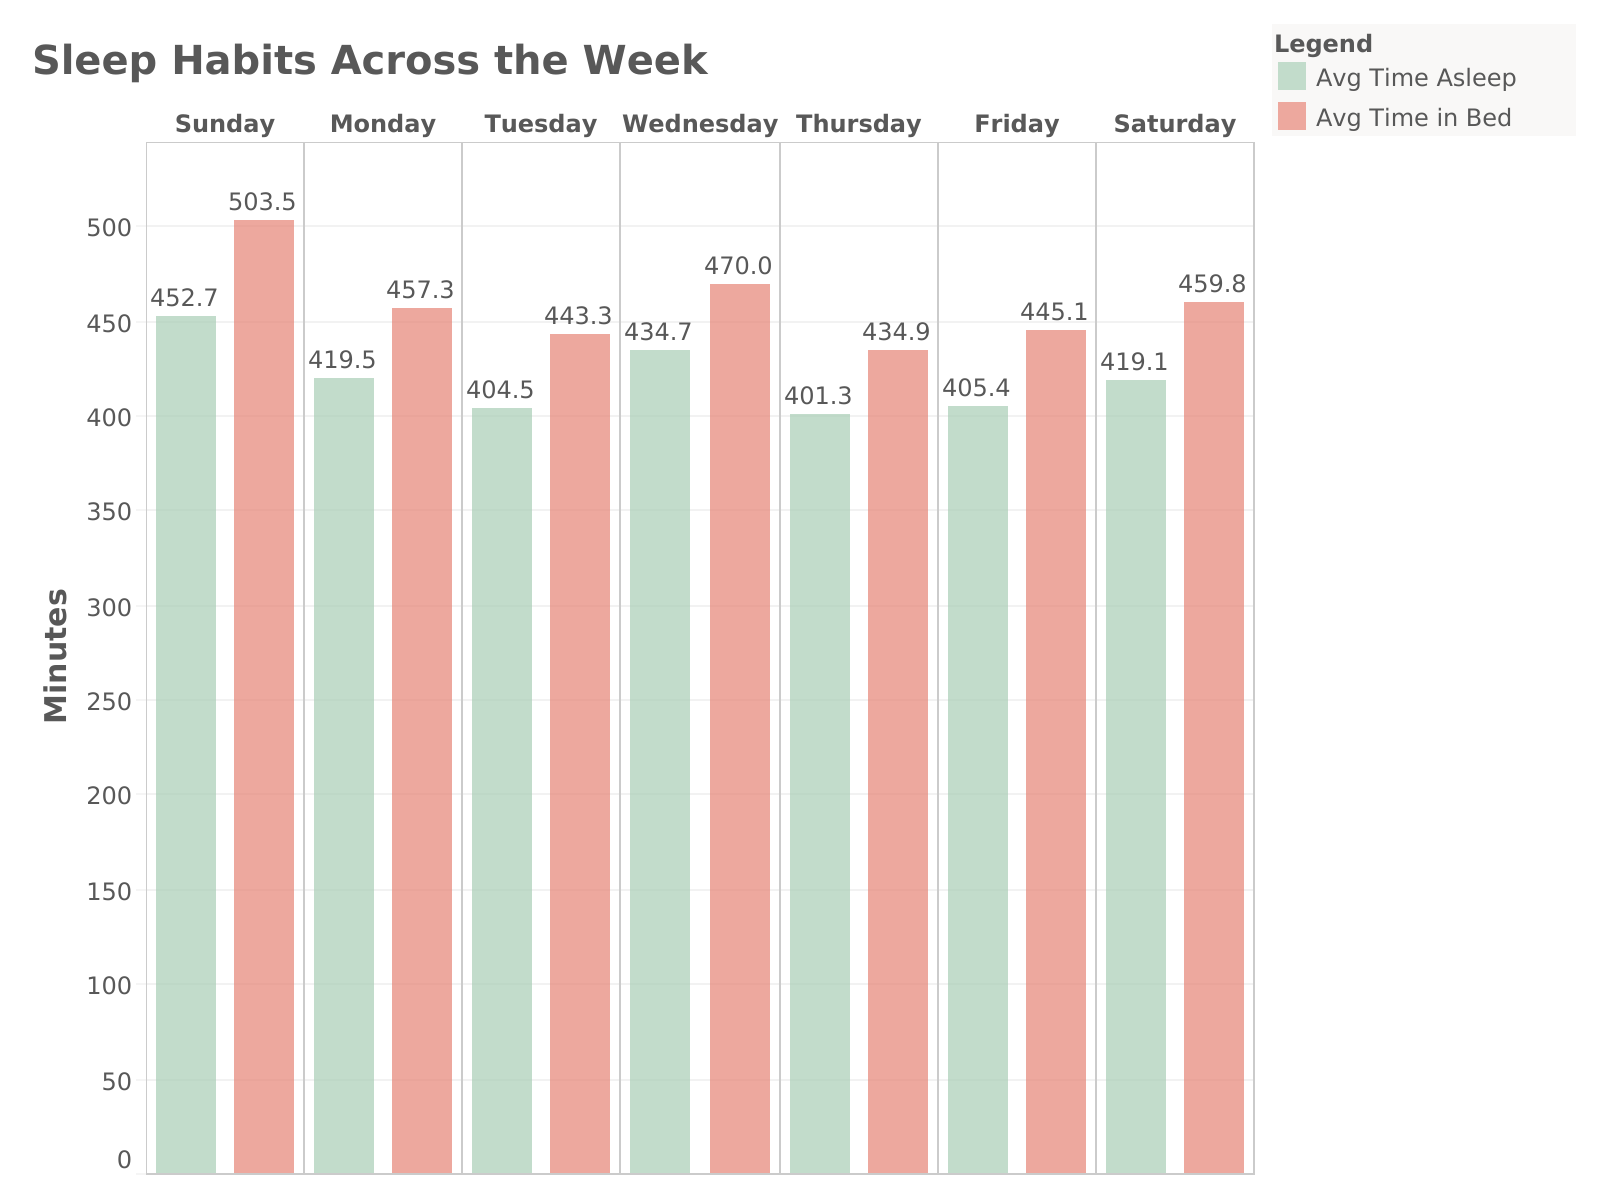
Users tend to spend the most time in bed and asleep on Sundays. Throughout the week, there is a discrepancy between the amount of time users spend in bed vs the amount of time they are actually asleep.
Key Takeaways:
- These insights can be used to refine Bellabeat’s mindfulness features (e.g., promoting better sleep through relaxation exercises) and highlight the benefits of good sleep in marketing campaigns.
Now let's compare how TotalMinutesAsleep compares with the TotalSteps taken in a day.
SELECT
	sleep.Weekday,
    AVG(sleep.totalminutesasleep) AS AvgSleepDuration,
    AVG(step.StepTotal) AS AvgSteps
FROM `Bellabeats`.`sleepday` AS sleep
JOIN `Bellabeats`.`hourlysteps` AS step
	ON sleep.id = step.id
    AND sleep.sleepday = step.activityhour
GROUP BY sleep.Weekday
ORDER BY FIELD(sleep.Weekday, 'Sunday', 'Monday', 'Tuesday', 'Wednesday', 'Thursday', 'Friday', 'Saturday');
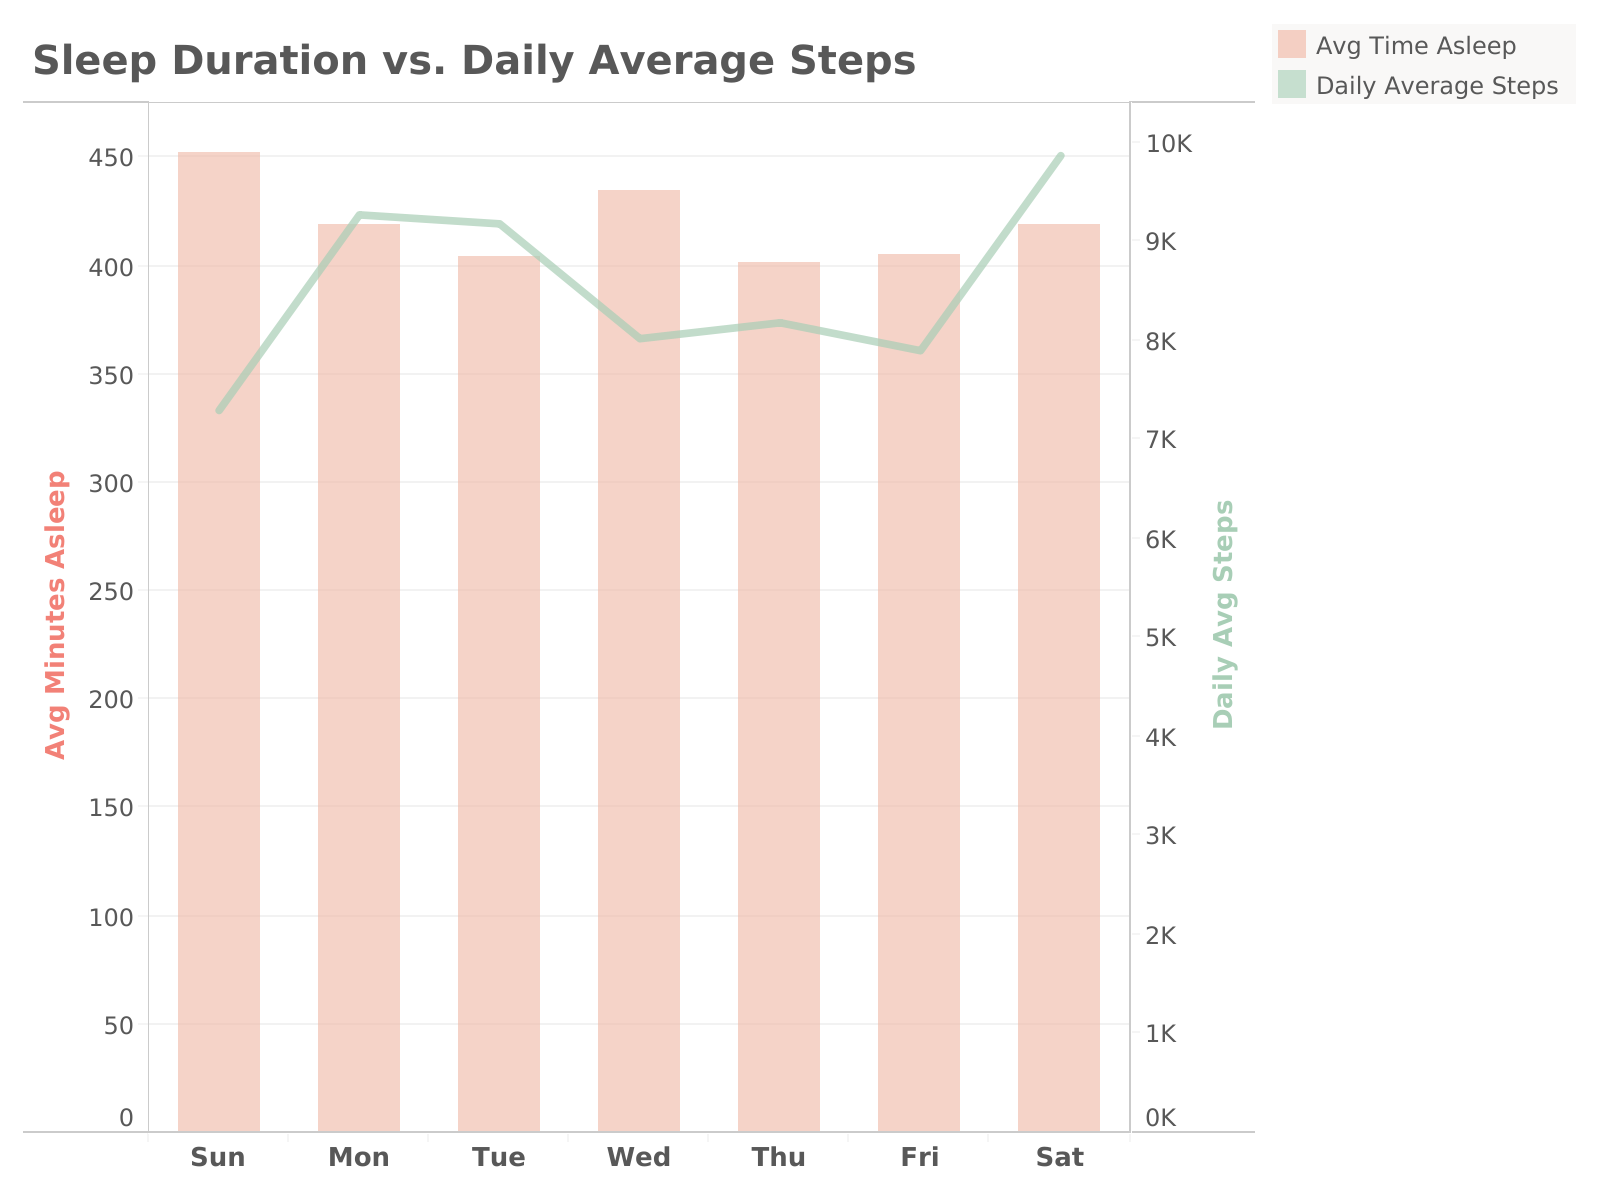
Step-count tends to be lower on Sundays and Wednesday - Fridays. The data also shows variation in sleep duration and daily step count.
Key Takeaways:
- Bellabeat could develop day-specific challenges or promotions. For example, since we see that step count is lower mid-week, a campaign like "Step it Up Wednesday" could be promoted offering in-app badges or rewards for achieving step goals on those days.
- For the sleep vs step variation, Bellabeat could launch a campaign emphasizing the importance of balancing sufficient sleep and daily activity linking it to general wellness and health.
Summary and Recommendations
Bellabeat's target audience are health-conscious women, aged 18-65, seeking to improve their lifestyle through daily step goals, daily activity, tracking calories, and quality sleep. In order to design new marketing strategies and increasing user engagement, we have to refer to the analysis provided above and keep the data in mind. The data suggests that women who work full-time jobs (according to hourly intensity data) spend a lot of time at work/in-office in sedentary time. They often struggle to reach the CDC recommended 10,000 step goal, but they do make time for some light physical activity throughout the week.
Top Recommendations
- Using this data, Bellabeat can use peak hours for physical activity or when they fail to reach step milestones to promote fitness challenges or push notifications (e.g., reminders to stay active) during these times.
- Offer virtual badges or in-app rewards for reaching the daily 10,000 step count
- Bellabeat can also craft features like workout suggestions for users during these peak hours to increase engagement.
- Create informational blog posts, emails, or social media campaigns that explain the relationship between steps and calorie burn, including how users can improve their step count to burn more calories. For example:
- “How Many Calories Can You Burn with 10,000 Steps?”
- “The Science of Steps: Why Walking More Leads to Higher Calorie Burn.”
- These insights can be used to refine Bellabeat’s mindfulness features (e.g., promoting better sleep through relaxation exercises) and highlight the benefits of good sleep in marketing campaigns.
- Bellabeat could develop day-specific challenges or promotions. For example, since we see that step count is lower mid-week, a campaign like "Step it Up Wednesday" could be promoted offering in-app badges or rewards for achieving step goals on those days.
- Launch a campaign emphasizing the importance of balancing sufficient sleep and daily activity linking it to general wellness and health.